
Mathedu Courses
Mathedu Courses
If you see this, something is wrong
First published on Sunday, Aug 30, 2026 and last modified on Tuesday, Sep 1, 2026
Solve a Square Matrix Equation in Python
And now we shall discover the Python function solve of A and B to solve a square matrix equation in Python.
But let's solve a matrix equation in Python.
Launch Anaconda and Spyder and follow me.
We create a new file.
We save it, to put it in the right directory, and to give it a name: SolveLinearSystem.py, because solving matrix equations is exactly the same as solving linear systems.
From numpy import * to import the scientific library numpy.
And from numpy.linalg import * to import the function solve of A and B.
And from matplotlib.pyplot import * to have the graphical library to have the very useful function imshow.
from numpy import *
from numpy.linalg import *
from matplotlib.pyplot import *We create a random matrix with the random.randn function of numpy.
The matrix is with 10 rows and 10 columns.
It is a square matrix.
And we visualize A with the imshow function of matplotlib.pyplot.
and we give a title to the figure: 'Coefficients Matrix A'.
A=random.randn(10,10)
imshow(A)
title('Matrix A')We save and we run.
And we obtain a visualization of the matrix with a color for each value.
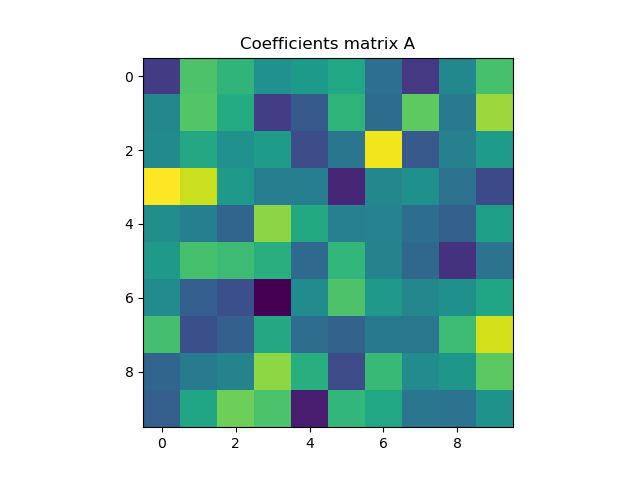
The coefficient matrix A
Now we create a column vector B, a random column vector with 10 elements, 10 rows and one column.
And big X is the column vector that is the solution of the matrix equation AX equals B.
We create a figure and we divide the figure into two zones, one row and two columns.
First zone, and we visualize the column vector B and the title is second member vector B.
And then in the second zone of the figure, we visualize the product, the matrix product, A@X.
It is the matrix product in Python, @.
The title is product AX.
B=random.randn(10,1)
X=solve(A,B)

figure()

subplot(1,2,1)
imshow(B)
title('Column vector B')

subplot(1,2,2)
imshow(A@X)
title('Product AX')We save.
And we run.
And now we have two figures.
The figure 2 with the second member's vector B and the product AX, and the figure 1 with the coefficient matrix A.
We save.
the first figure: we put it in the right directory and we give it a name CoefMatrix.png.
And we save the second figure we give it a name SolutionCheck.png.
Indeed In the second figure, you see that B is equal to the product AX, so that X is a solution of the matrix equation AX equals B.
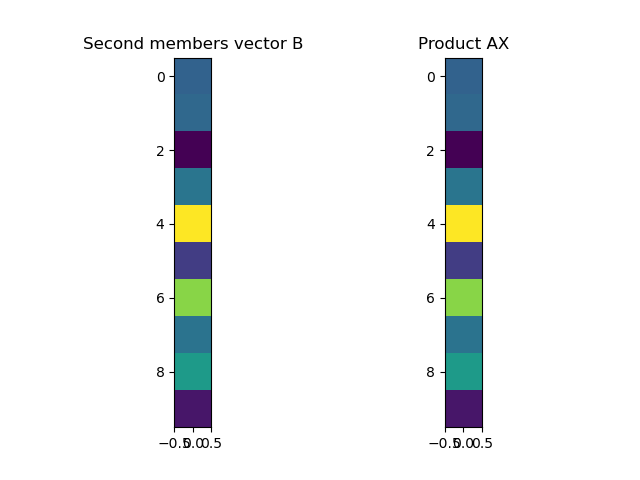
Solution Check
What's coming now? Now we shall see an application to astronomy: relate the periods of planets to their distances to the Sun.