
Mathedu Courses
Mathedu Courses
If you see this, something is wrong
First published on Wednesday, Sep 2, 2026 and last modified on Thursday, Sep 3, 2026
Application to Astronomy
Now we shall see an application of the polynomial fit to astronomy to relate the periods of planets to their distances to the Sun.
Let's see a nice image of the Sun and its planets.
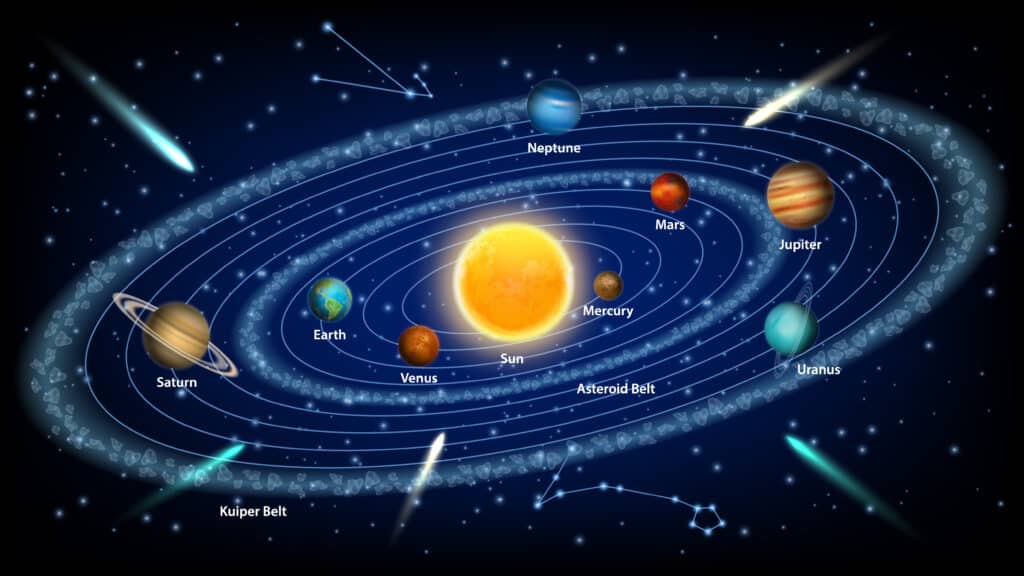
Solar System
And now let's see a table of mean distances on periods of the planets.
The distances are measured in astronomical units, the periods are measured in years.
Mercury, Venus, Earth, Mars, Jupiter, Saturn.
The mean distance to the sun of Mercury is 0.387.
For Venus it is 0.723.
For the Earth it is 1.0 by definition of the astronomical unit.
For Mars it is 1.523.
For Jupiter it is 5.203.
And for Saturn it is 9.541.
And the period of Mercury is for Mercury 0.241, for Venus 0.615, for the Earth 1.0, by definition of the year, for Mars 1.881, for Jupiter 11.861, and for Saturn 29.457.
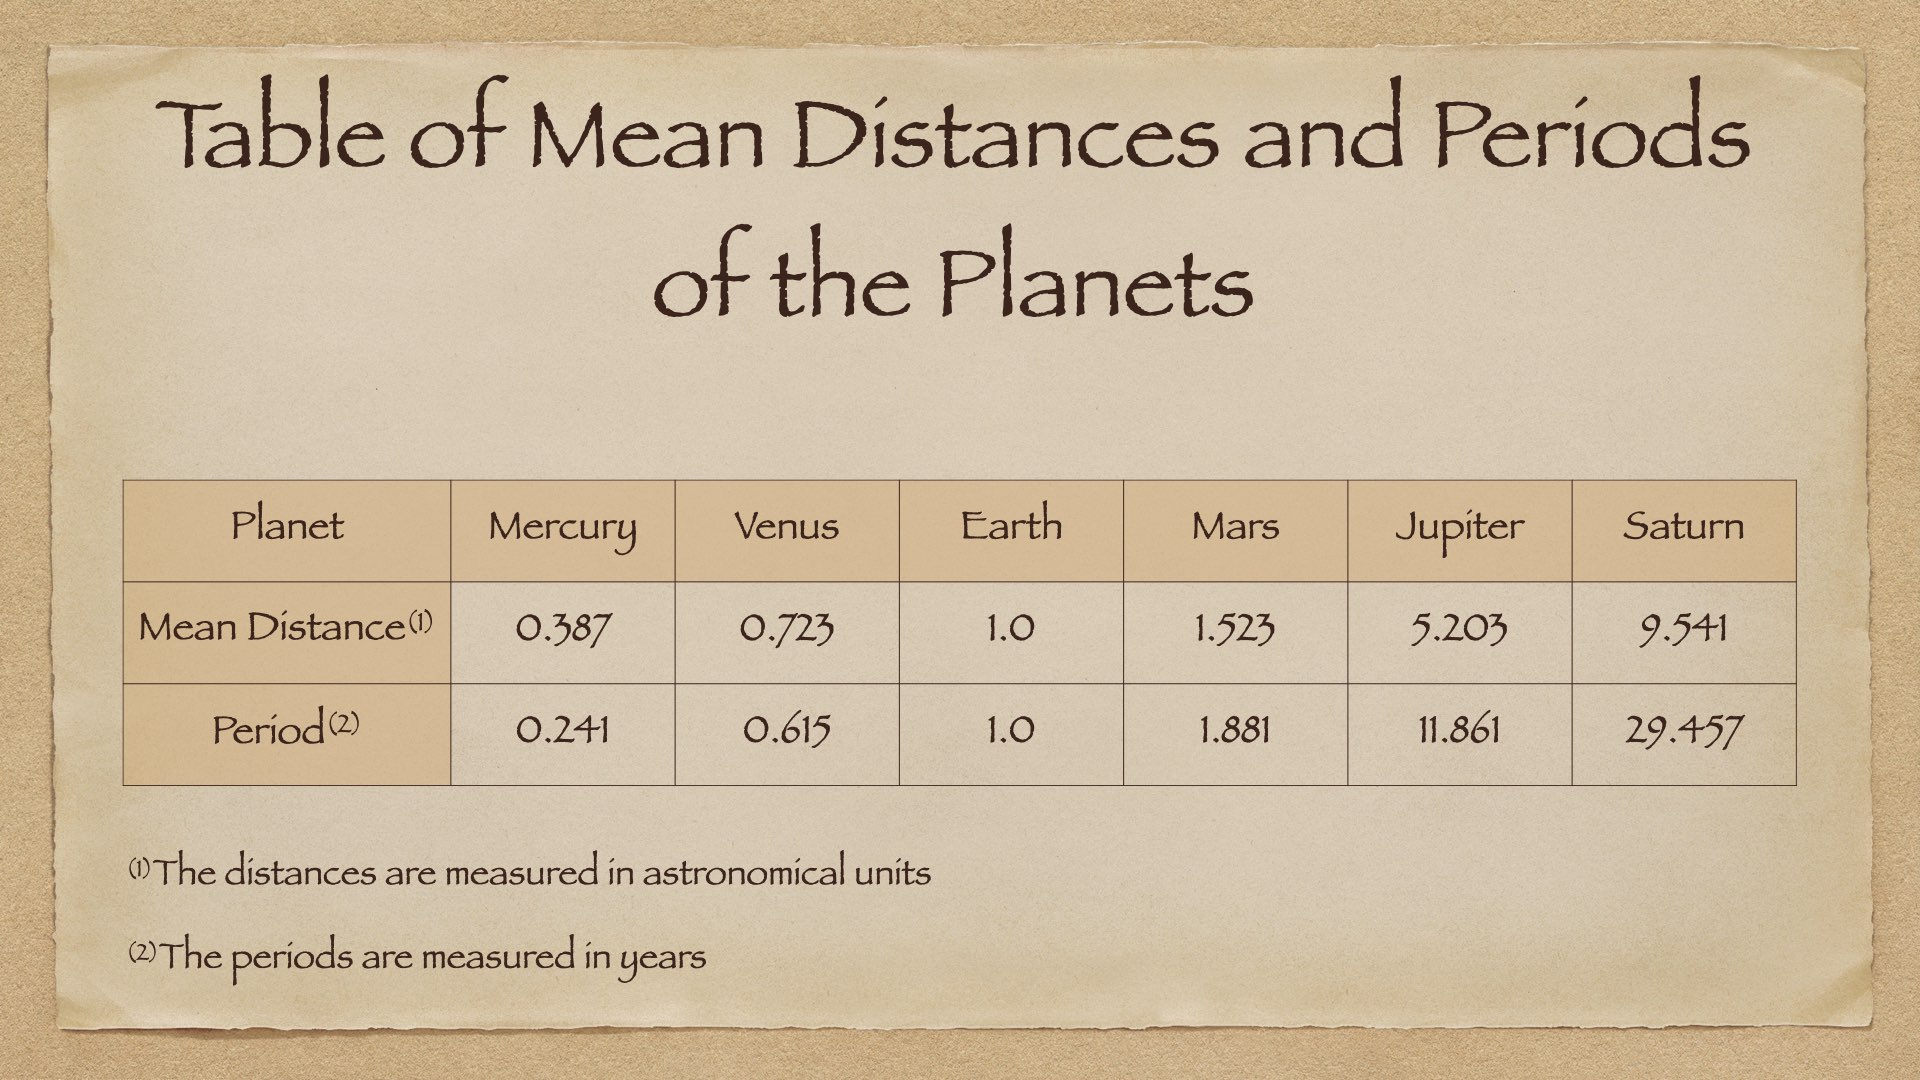
Table of Dista,ces to the Sun and Period of Planets
Now let's find a polynomial that relates the periods of the three first planets to their distances to the Sun.
We remember the table.
We have to fit a quadratic polynomial P equals a0 plus a1 x plus a2 x^2, to the points (0.287, 0.241), (0.723, 0.615) and (1.0, 1.0).
We have to solve the system a0 plus 0.387 a1, plus 0.387 to the square a2, equals 0.241.
a0 plus 0.723 a1, plus 0.723 to the square a2, equals 0.615.
and a0 plus a1 plus a2 equals 1.
\( \left\{ \begin{matrix} a_0&+&0.387a_1&+&(0.387)^2a_2&=&0.241\\ a_0&+&0.723a_1&+&(0.3723)^2a_2&=&0.615\\ a_0&+&a_1&+&a_2&=&1 \end{matrix} \right.\)
And then we will check the solution with the three next planets: Mars, Jupiter and Saturn.
We will do it in Python, Launch Anaconda and Spyder and follow me.
We create a new file, we save it to give it a name and to put it in the right directory.
The name is Planets.py.
from numpy import *, to import the scientific library Numpy.
And we import also the sub library numpy.linalg, to have the solution of linear systems, the function solve.
And we import also matplotlib.pyplot to have the graphics.
from numpy import *
from numpy.linalg import *
from matplotlib.pyplot import *Now we create a vector with the distances of the planets to the sun in astronomical units.
We call it dist equals array 0.387, 0.723, 1.0, 1.523, 5.203 9.541.
Now we create a matrix that is the coefficients matrix.
A equals array, into parentheses into brackets into brackets.
The first row is 1.0, dist of 0, dist of 0 to the power 2.
The second row is 1.0 dist of 1 dist of 1 to the power 2.
And the third row is 1.0 dist of 2, dist of 2 to the power 2.
And we print 'The coefficients matrix that is A equals x\n', to go to the line, comma A.
We save and we run.
And in the second column of the matrix we have the distances to the sun of the first three planets.
# Distances of the planets to the sun in AUs
Dist=array([0.387,0.723,1.0,1.523,5.203,9.541])

# Coefficients matrix
A=array([[1.0,Dist[0],Dist[0]**2],
         [1.0,Dist[1],Dist[1]**2],
         [1.0,Dist[2],Dist[2]**2]])
print('The coefficients matrix is A=\n',A)Now we create a vector with the pairs of the planets in years.
We call it Period equals array into parentheses into brackets, 0.241, 0.615, 1.0, 1.881, 11.861, 29.457.
And now we create a column vector with the second members of the linear system.
B equals array into parentheses, into brackets, into brackets, there are double brackets because it is a column vector.
The first element is Period of zero.
The second element is Period of one.
And the third element is Period of two.
And we print 'The second members column vector (there is a typo) is B equals \n', to go to the line, comma B.
We save and we run.
And we have a column vector with the periods of the first three planets in years.
# Periods of the planets in years
Period=array([0.241,0.615,1.0,1.881,11.861,29.457])

# Second members column vector
B=array([[Period[0]],[Period[1]],[Period[2]]])
print('The second members column vector is B=\n',B)Now we calculate the polynomial that fits the first three planets data.
Little a equals solve of big A, big B.
We have the solution of the linear system.
a1 equals, no, a0 equals a of 0,0.
a1 equals a of 1,0.
a2 equals a of 2,0.
Print 'The polynomial is P(x) equals', a0, '+' a1, 'x +', a2, 'x^2'.
And we have a nice quadratic polynomial.
# The polynomial that fits the first three planets data
a=solve(A,B)
a0=a[0,0]
a1=a[1,0]
a2=a[2,0]
print('The polynomial is P(x)=\n',a0,'+',a1,'x +',a2,'x^2')Now we shall visualize the solution, the fitting.
x equals arange of 0 to 2.01, the numbers from 0 to 2 by steps of 0.01.
y equals a0 plus a1 multiplied by x plus a2 multiplied by x to the square.
And we plot x and y, with the label 'Polynomial'.
Now we plot a dot with the position of Mercury, plot dist of zero, period of zero, KO, marker size equals three.
We do the same for Venus with the indexes 1 and for Earth with the indexes 2.
We add a grid and we add a legend.
And you see that the three dots are exactly on the polynomial curve.
# Visualisation
x=arange(0,2,0.01)
y=a0+a1*x+a2*x**2
plot(x,y,label='Polynomial')
# Mercury
plot(Dist[0],Period[0],'ko',markersize=3)
# Venus
plot(Dist[1],Period[1],'ko',markersize=3)
# Earth
plot(Dist[2],Period[2],'ko',markersize=3)
grid()
legend()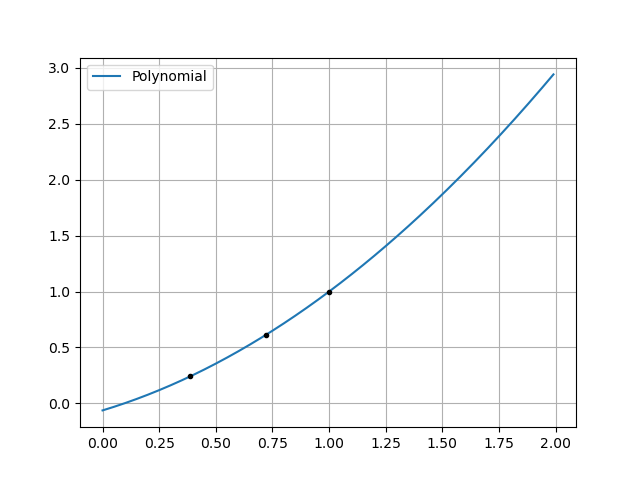
Polynomial Fit
Now we check if Mars is on the polynomial with the distance of 3 and period of 3.
P of March equals a0 plus a1 multiplied by dist of 3 plus a2 multiplied by dist of 3 to the square.
And we print the error of March is Period of 3 minus P of Mars and you see that the dot for Mars is not exactly on the curve.
We save the figure, we put it in the right directory and we call it planets1.png and you see that the error for Mars is 3 per cent of a year, about 10 days.
# Check
# Mars
plot(Dist[3],Period[3],'ko',markersize=3)
P_of_Mars=a0+a1*Dist[3]+a2*Dist[3]**2
print('The error for Mars is ',Period[3]-P_of_Mars)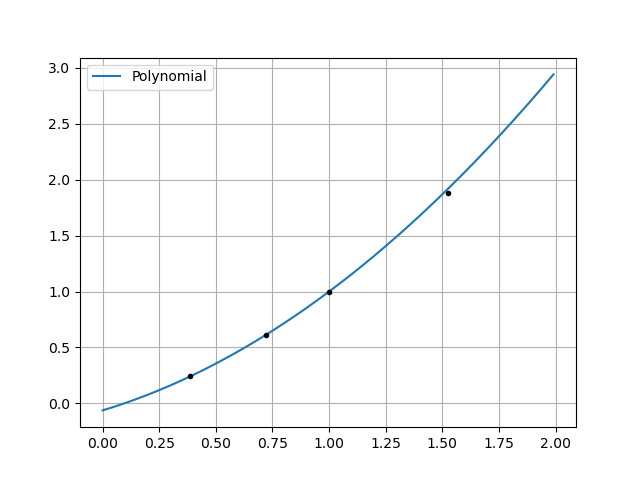
Check March
We calculate the error for Jupiter with the indexes 4 and the error for Saturn with the index 5.
We save and we run.
And you see that the error for Jupiter is quite big and the error for Saturn is even bigger.
The polynomial fit for the first three planets doesn't allow extrapolation to further planets.
# Jupiter
P_of_Jupiter=a0+a1*Dist[4]+a2*Dist[4]**2
print('The error for Jupiter is ',Period[4]-P_of_Jupiter)
# Saturn
P_of_Saturn=a0+a1*Dist[5]+a2*Dist[5]**2
print('The error for Saturn is ',Period[5]-P_of_Saturn)However, the natural logarithms of all the data fit with the straight line of equation big Y equals three halves of big X.
and Spyder and follow me.
We open the previous file, planets.py, and we continue it.
Now we will fit the natural logarithms with a straight line.
ln dist equals log, it is a natural logarithm in Python, of dist.
And ln_Period equals log of Period.
Big X equals the numbers from -2 to 4 by steps of 0.01, and big Y equals 3/2 multiplied by X.
We create a new figure and we plot big X and big Y.
with the label 'The straight line'.
Now we add ln in front of distance and period for the three first planets.
We continue with March with Jupiter and with Saturn.
We add a grid and a legend.
We save and we run.
And we obtain the points on a nice straight line We save the figure in the right directory with the name planets2.png.
# Fitting the natural logarithms with a straight line
LnDist=log(Dist)
LnPeriod=log(Period)
X=arange(-2,4,0.01)
Y=(3/2)*X

figure()
plot(X,Y,label='The straight line')
# Mercury
plot(LnDist[0],LnPeriod[0],'ko',markersize=3)
# Venus
plot(LnDist[1],LnPeriod[1],'ko',markersize=3)
# Earth
plot(LnDist[2],LnPeriod[2],'ko',markersize=3)
# Mars
plot(LnDist[3],LnPeriod[3],'ko',markersize=3)
# Jupiter
plot(LnDist[4],LnPeriod[4],'ko',markersize=3)
# Saturn
plot(LnDist[5],LnPeriod[5],'ko',markersize=3)

grid()
legend()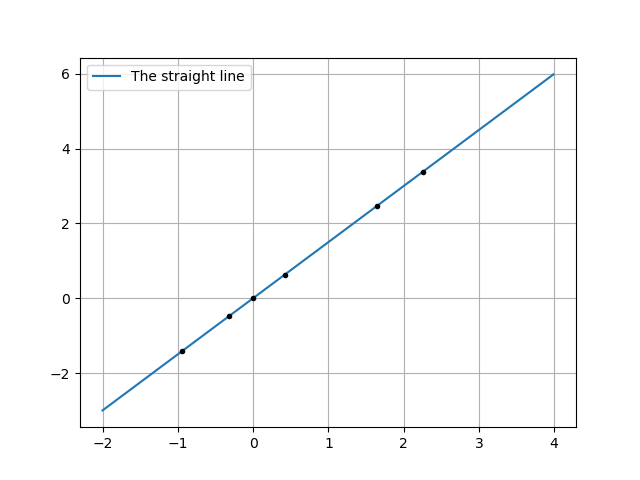
Aligned Logarithms
And we may deduce a law for the periods of the planets related to their mean distances to the sun.
If D is the distance to the sum of a planet and P is its period, then they are related to one another with the formula ln of P equals three halves of ln of D or ln of, P to the square, equals ln of, D to the cube.
Consequently, there exists a constant K such that P to the square equals K, D to the cube.
That is, the square of the period of a planet is proportional to the cube of its distance to the Sun.
This is the third Kepler law for the planets of the solar system.
The ratio of the square of an object's orbital period with the cube of the semi-major axis of its orbit is the same for all objects orbiting the same primary.
\( P^2=KD^3\), the constant \( K\) is to take into account the measurements units. It is \( 1\) for the Astronomic Units for the distance \( D\) and the year for the period \( P\) .
What's coming now? Now you will have a recapitulative document titled 'Discover the systems of linear equations'.